Enso Analytics User Interface Basics
This guide will show you the basics of Enso's Graph Editor, where you will build powerful data and analytics workflows!
Enso Data Catalog
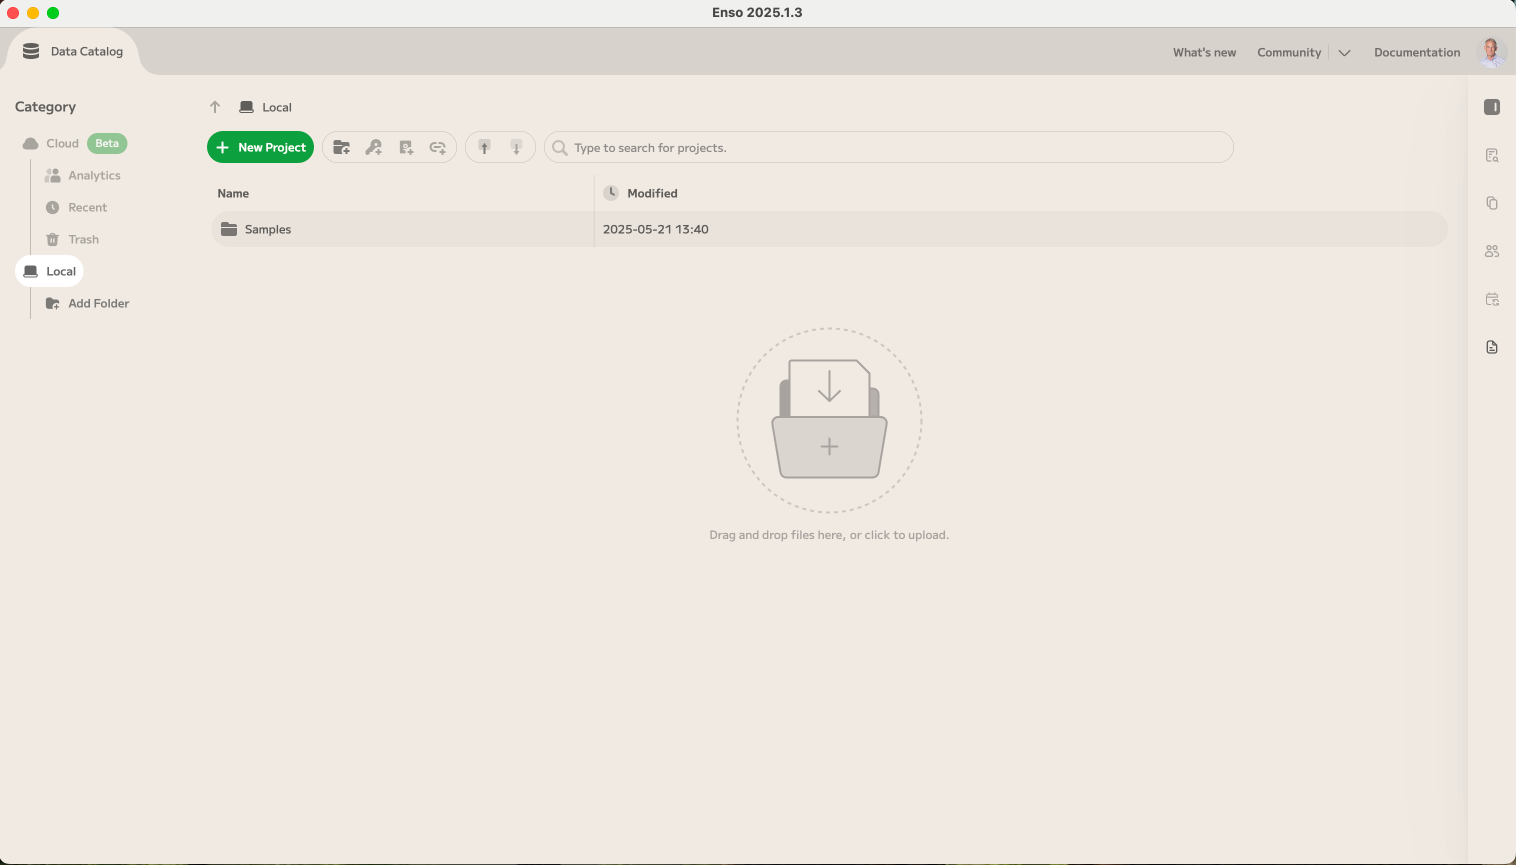
Once you log into Enso Analytics, the application launches to the Enso Data Catalog. If you are on one of Enso's paid tiers, you will have access to many valuable capabilities in the Cloud category on the left.
In the Community Edition, this is where you will find your Enso Project files (also called Enso Workflows). These can be organized into folders based on your preference.
Sample Projects
In the "Samples" folder, you will find a number of sample projects.
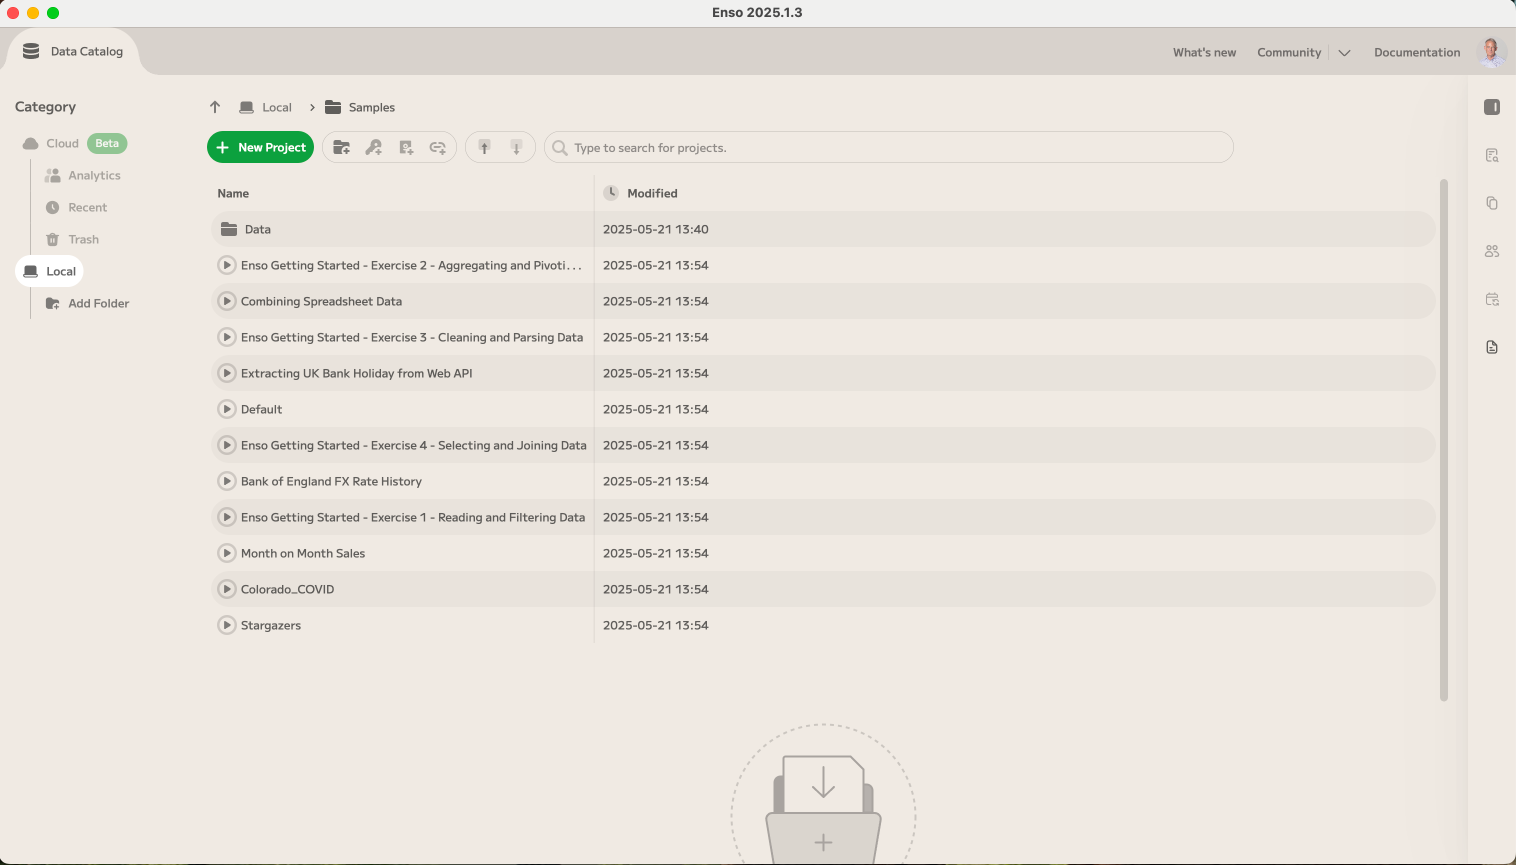
You will notice four of these projects are named Enso Getting Started - Exercise. These projects all relate to a learning module on the Enso Community that is free to use. You can find these exercises here.
Preview Project Documentation
If the author of the Enso Workflow added documentation, you can preview the project documentation from the Data Catalog.
Open Existing Project
Open an existing project by clicking on the ▶︎ button to the left of the project name.
Close Workflow
To close an Enso Project, click on the dot on the right side of the Project Tab.
Create a New Project
Navigate to the folder where you would like to create the new project, and click on the green New Project button to begin.
Rename Your Project
This step is optional, but we recommend you give your projects names that make them easy to identify later. You can rename your project at any time. There is no Save button in Enso. All projects are automatically saved every time that you close the project or close Enso if a project happens to be open.
When you close a project in Enso that is stored in the Enso Cloud, you will be able to take advantage of Version History, which allows you to restore older versions, what the specific changes were, and who made them.
Enso Graph Editor Overview
The Graph Editor is where you will build and execute Enso Workflows.
Learning to Navigate the Enso Graph Editor
At the top of the screen you will find a number of navigation menus and icons.
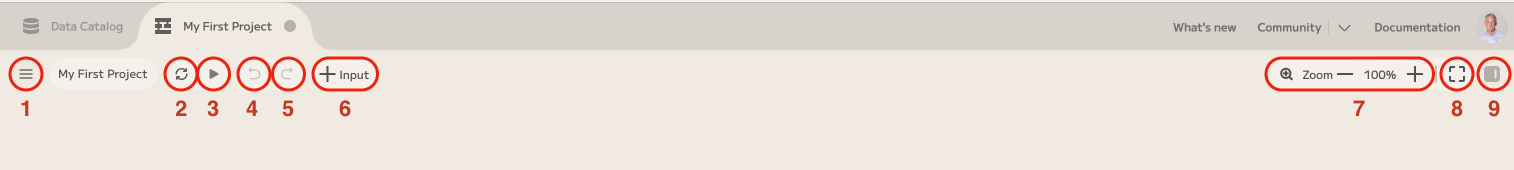
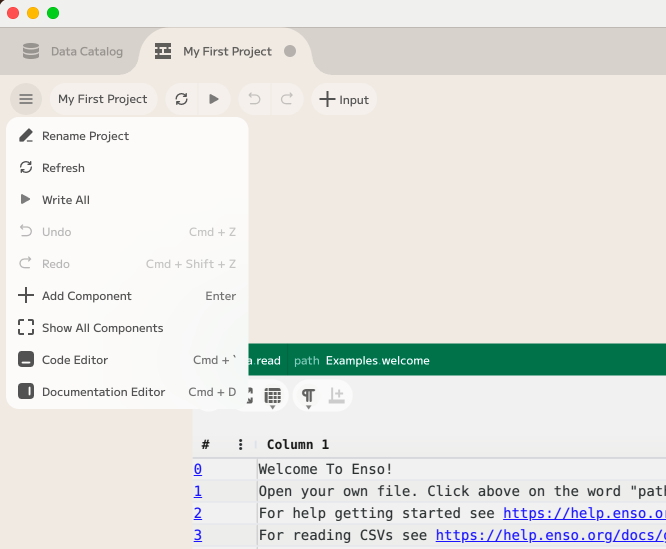
- Hamburger Menu - shortcuts to many common tasks, including renaming a project. You can start to discover some of the many keyboard shortcuts in this menu. For a complete reference, see this guide.
- Refresh - Unlike many other data analytics platforms, Enso doesn't need a run button as it calculates each component as you build your workflow. Use the Refresh button if your source data changes, or if Enso gets in a state where it requires a refresh.
- Write All Outputs - Enso won't write to outputs, including writing to files, updating or creating database tables, or performing an http post, put, patch or delete until you click this button.
In versions of Enso that include unattended execution, including time based scheduling, write operations happen without the need to press a write button during the scheduled task.
- Undo - If you want to undo one or more steps that you have performed in building a workflow, undo has you covered.
- Redo - If your undo went too far, you can redo the last one or more steps.
- Input - Brings up the Component Browser for workflow inputs. These include file inputs, web-based inputs, database inputs, as well as data such as the current date or time.
- Zoom Controls - Allows you to zoom in or zoom out on your workflow.
- View All - Zooms to the full extent of the workflow if no components are selected, or zooms to the extent of selected components, if any. If you ever open a workflow and don't see anything, try View All!
- Documentation Panel - Opens and closes the documentation panel on the right of the workflow. This panel is resizable when open. You can switch between documentation for the workflow, and documentation for a selected component in the workflow.
Adding, configuring and moving a component
Reading a file is the most common starting point for most workflows. You can drag a file onto the canvas (the background of the graph editor), and this will configure a Data.read component referencing the data on your local system.
Alternatively, you can click the "Input" button in the top navigation, as described in #6 above.
Since this CSV is well structured, has a header row, and doesn't require skipping any rows, I don't need to make any changes. If I did need to make changes, changing the format to its type, in this case Delimited, additional configuration options will appear on the component to allow a user to make fine grained changes.
To move a component, click and hold the left mouse button on the icon at the upper left of the component and move the component to the desired location.
There is a hamburger menu on each component that provides a number of options. Also on the quarter circle menu you have access to the two most common choices. Help and Show/Hide Visualization.
Finally, at the bottom of the component is a small line with a plus at the end. By clicking on this + you will now have access to components that are relevent to the specific data. In this case, we are seeing the list of Table components in the Component Browser.
Selecting and De-Selecting Component(s)
To select one or more components, you can click and drag from a blank spot on the canvas over the component(s) that you wish to select. Alternately, you can click on the icon at the upper left of a component to select it, and click the left mouse button. Holding the shift button allows you to click on multiple components if you need to select more than one.
You will notice that the color for the components lightens to signify which components are selected.
A left click on any blank spot on the canvas will deselect all components. If you have multiple components selected, holding the space button while clicking on the component will deselect that specific component.
Deleting a Component
To selected components from your workflow, use BackSpace or Delete on your keyboard, or choose the hamburger menu from the component and choose Delete.
Copying and Pasting Components
Copying components can save lots of time when building a workflow. For example, you build a filter that finds dates that are greater than or equal to 2025-01-01. By creating a copy and then pasting the component, you simply update the filter condition to capture all records that are less than 2025-01-01.
Select the componnent and choose Copy from the hamburger menu, or Ctrl + C (Windows/Linux) Command ⌘ + C (Mac).
Click the mouse where you would like to place the new component.
Paste the component with Ctrl + V (Windows/Linux) Command ⌘ + V (Mac).
You can now edit the component as you wish.
Output Ports
The + that hangs off of the bottom left of a component when your mouse approaches it is a visual cue that you can add a new component here. But the entire bottom of each component is an output port and you can connect an unlimited number of outputs to a single component.
As your mouse gets near any part of the output port, you will notice a plus sign at the end of a line connected to the output port. Hold your left mouse button down and release where you would like to add a new component.
Adding and Configuring a Component
Data moves from one component to the next. When you operate on data by changing values, filtering, sorting, adding columns, etc., the source data is never changed.
Here we add a filter component and configure its parameters to filter just records that have a [next_step_date] that is greater than or equal to 2025-01-01. I could have chosen this from the list, but I started typing the word "Filter" and it narrowed down my list.
Enso has a growing list of alias names as well for components. "Where" is an alias in the Component Browser for "Filter" as it is a common alias in SQL.
You can see at the bottom of the Data.read visualization for the crm.csv file that there are 2036 rows.
After the filter, there are 82 rows in the new table.
Adding Another Component
From the filtered 82 row table, we build a cross_tab.
Notice that it only has 14 rows, as these are the only [next_step_dates] greater than or equal to 2025-01-01.
Reconnecting Components
You can change the flow of the connections at any time. In this case, we want to cross-tab the results from the unfiltered data.
Drag a new connection from the output port at the bottom of the first Data.read component by clicking and holding the mouse. Release the mouse on top of the icon for the desired component.
Interacting with the Table Visualization
You can sort and filter in the visualization. These visual changes do not change the order of the data or remove any data from downstream components as they are visual only.
You can, however, apply these changes with a single click in the visualization. The data is sorted by clicking on the column name in the visualization. Notice the ⬆️ that appears in the column header in the visualization near the [next_step_date]. To apply this sort to the data, click the Create New Components button in the visualization. Notice how a sort was added and configured in the workflow.
Full Screen Visualizations
Visualizations can be opened in full-screen mode. Click the button with the four outward facing arrows at the top left of the visualization.
You can hit Escape or click on the four inward facing arrows a the top left of the visualization to return to the previous view.